 NERC Data Catalogue Service
Satellite imagery
Type of resources
Topics
Keywords
Contact for the resource
Provided by
Years
Formats
Representation types
Update frequencies
Scale
-
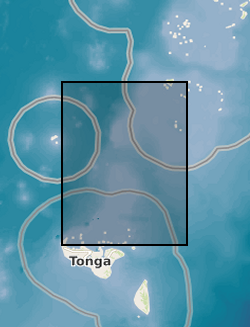
Tsunami trimlines identified across different islands of the Tonga archipelago. Trimlines have been used as a reference land feature following the January 2022 Tonga tsunami event that ripped off vegetation and built-up areas. Trimlines are distinctive limits between an area with sand coverage, vegetation destruction, and soil erosion on the one hand, and the unaffected natural vegetation on the other. This distinction provides a good landmark to map the inundation width and the landward extension of tsunami runup. In this case, the trimlines have been manually delineated by BGS - Earth Observation team using different high-resolution satellite datasets both optical (KompSat, Planet, Pleiades, WorldView) and radar (TerraSAR-X). Trimlines are well known from task-force publications documenting recent tsunami detection efforts and provide key information to support tsunami triggering mechanism models. For more info, see https://www.usgs.gov/media/images/tsunami-terms and Scheffers et al. (2012), https://doi.org/10.1007/s11069-010-9691-6
-
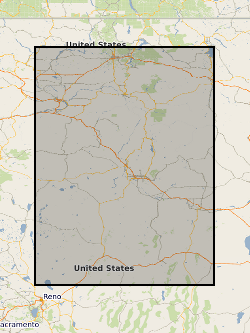
Processed SAR interferograms for the Wells, Nevada earthquake. Grant abstract: How do earthquakes happen? Understanding the nature of earthquakes is a key fundamental question in Geociences that holds many implications for society. Earthquakes are typically associated with a sudden release of energy that has slowly accumulated over hundreds to thousands of years, being strongly controlled by friction in faults buried several kilometers beneath our feet under quite extreme conditions. For example, the amount of heat produced in just a few seconds is such that it can dramatically change the nature of the fault zone near the sliding surface. Moreover, there is abundant evidence of substantial frictional weakening of faults (i.e., fault strength weakens with increasing slip or slip rate) during earthquakes. However, there are still many open questions related to earthquake source processes: How similar are earthquakes in different temperature-pressure conditions? What is the earthquake's energy budget, which controls the intensity of ground motions? What are the physical mechanisms responsible for fault weakening? Recent progress in seismological imaging methods, theoretical fracture mechanics and rupture dynamics simulations can help solve these questions. Huge volumes of freely available seismic and geodetic data from around the world now allow the routine calculation of earthquake models where earthquakes are typically described as single space-time points. Time is now ripe for systematically building robust, more detailed seismic models bearing information on earthquake's physics by using recently developed sophisticated modelling tools along with high-quality images of the 3-D Earth's interior structure enabled by high performance computing facilities. Moreover, it is now possible to model ruptures theoretically in detail using both analytical fracture mechanics calculations and numerical rupture dynamics simulations, and, for example, estimate the fault temperature during the rupture process, which is the most direct way to quantify friction. However, systematic quantitative links between these calculations and seismological observations are still lacking. This project addresses these issues through a coordinated effort involving seismology and rock mechanics aiming at estimating fault temperature rise during earthquakes from new macroscopic seismic source models. We will use advanced seismic source imaging methods to build a new set of robust kinematic, static and dynamic earthquake source parameters for a large selected set of global earthquakes (e.g., average fault length, width, rupture speed and time history, stress drop, radiated and fracture energy). These solutions will then be used as input parameters to estimate fault temperature using analytical and numerical rupture dynamics calculations. This will lead to an improved understanding of how local fault processes occurring at scales from few microns to tens of centimetres translate into macroscopic seismological properties, how energy is partitioned during earthquakes and which are the mechanisms responsible for fault weakening. Ultimately this project will shed new light on many basic questions in earthquake science such as the similarity of earthquakes in different P-T conditions and the potential geological record left by ruptures (e.g., melt). More broadly, this project will benefit hazard models and any studies relying on accurate earthquake source parameters such as studies in seismic tomography, active tectonics and microseismicity (e.g., associated with hydraulic fracturing).
-
This data set is an inventory of aerial photographs held at BGS, Murchison House office and consists of a MS Excel spreadsheet containing 11 worksheets. Each worksheet contains information pertaining to the different sub-collections within the collection (9 worksheets of aerial photographs, one for aerial photograph scans, one for satellite imagery). Quality and coverage of metadata varies from worksheet to worksheet, depending on the size of the sub-collection, its pre-existing organisation, and the way in which the sub-collection was brought together (if it was not a complete entity when the inventory was started). Areal extent ranges from Shetland in the N (1200000) to the southern Lake District in the S (480000) and from Barra in the W (65000) to Stockton-on-Tees in the E (450000). By late 2001 all photos (except those being worked on by cuurently by staff) were catalogued in the inventory spreadsheet. By late 2003, the inventory spreadsheet had been updated with newly purchased and newly discovered photos as well as modified to include details of digital holdings and satellite imagery.
-
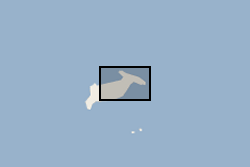
Waterlines have been extracted to delimit the edge of the Hunga Tonga - Hunga Ha'apai island between April 2017 and April 2022. Waterline is defined as the instantaneous land - water boundary at the time of the imaging process. Waterlines have been generated by BGS - Earth Observation team through a thresholding-based classification based on Sentinel-2 multispectral imagery and developed on Google Earth Engine. Specifically, the thresholding has been applied to the Normalized Difference Water Index (NDWI) has been derived as a basis to discriminate between the land and sea based on their spectral characteristics. Changes in waterlines over volcanic islands can provide key information to understand volcanic processes. For more info on the methodology, see Novellino et al. (2020) https://doi.org/10.3390/app10020536
-

**This dataset has been withdrawn and is no longer avaible from BGS** The database contains satellite images of the UK purchased by the BGS or on its behalf by NERC. It includes data from the Lansdat, SPOT, Radarsat and ERS satellites. The images are stored in proprietary format on various types of magnetic media. The data are currently stored by path-row scene numbers and as mosaics on tapes, CDs and drives. Entire UK is covered by the dataset, however, there are gaps in coverage from individual sensors. Coverage exists for countries (or parts of countries) where work has been carried out.
-
The BGS collection of downhole CCTV (Closed Circuit Television) recordings and backup tapes for worldwide SKYLAB satellite imagery. CCTV recordings carried out down boreholes, mainly drilled for water, were undertaken by BGS for specific commercial contracts in Great Britain, and may also have associated geophysical data. The collection started in 1997, and the present holdings are 138 videos, with infrequent additions. Video recordings on other topics may be added.
-
This dataset comprises locational data highlighting the geographic position of emperor penguin colonies along the circumpolar Antarctic coastline as identified from satellite imagery (Sentinel2 and MAXAR VHR (Very High Resolution)) from August to December 2023. This dataset is part of the long-term monitoring of emperor penguin colonies and will support conservation efforts in Antarctica. This dataset was supported by NERC core funding and WWF grant GB095701.